
.png)

.avif)

Most restaurant brands track loyalty enrollment. Few track what actually predicts revenue.
Getting a guest to the third purchase is where loyalty actually starts. It's where a trial guest becomes a repeat guest, where acquisition cost starts paying back, where visit frequency begins to compound. Miss it, and you've paid to acquire someone who churned before you broke even.
Activation Rate is the percentage of new guests who make a third purchase within 120 days. It's the single strongest leading indicator of same-store sales growth, and most loyalty platforms can't measure it.
Here's why it matters, and how Thanx slices it into six views operators can act on.
The third purchase is where loyalty actually starts
A 3rd-visit guest is worth 10–15x the lifetime value of an average new walk-in. After a third purchase, visit frequency over the next twelve months is roughly 4–6x higher than for guests who stopped at two.
The business math is direct. A 5-point improvement in Activation Rate, moving from 10% of new guests reaching a third visit to 15%, is worth 3–4 points of same-store sales. For a 100-unit casual dining brand at $1.5M AUV, that's approximately $4.5M in incremental annual revenue. The guests were already acquired. The cost to capture that lift is near zero.
The challenge isn't strategy. It's visibility.
What most platforms measure instead
Legacy loyalty platforms show enrollment counts and report that loyalty members spend more than non-members. Both are true. Neither is useful.
Guests who enroll in loyalty programs are already predisposed to love your brand. Measuring their spend against non-members doesn't tell you whether a first-time guest is becoming a regular. It doesn't tell you where in the funnel you're losing them, whether a specific store is the problem, or which items in a first order predict a return visit.
That's where same-store sales diverge between brands, and most operators can't see it.
How Thanx measures Activation Rate: six views
Thanx benchmarks Activation Rate across 200+ restaurant brands. Top-quartile brands hit 32%, nearly a third of new guests reach a third purchase within 120 days. Brands arriving from legacy platforms typically land in the 5–12% range. That 3x delta is the single biggest lever on Year-1 LTV.
The headline number tells you where you stand. These six views tell you what to do about it.
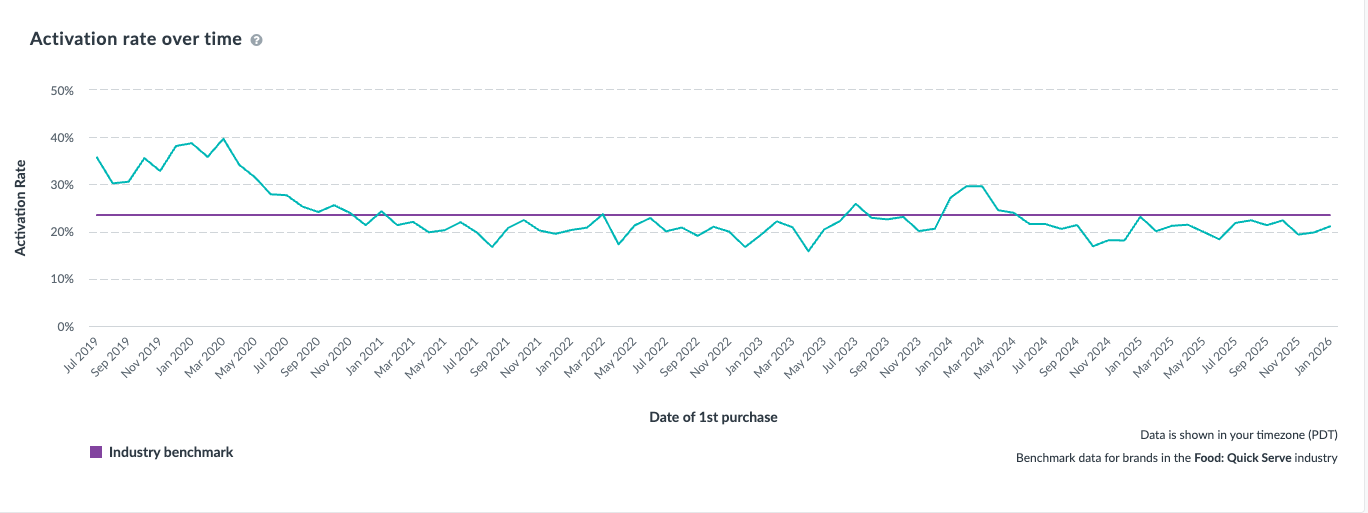
1. Trend over time
The view: Activation Rate by month of first purchase, plotted against the industry benchmark for your segment.
Why it matters: This is how you catch silent regressions. A drop from 26% to 22% over two quarters won't appear in your transaction data yet. It will show up in same-store sales six months later. Catching it here is the difference between early intervention and a bad quarter.
2. Cohort heatmap
The view: Each row is a month's new guests; each column is days-to-third-purchase. Read across a row to track how that cohort progresses. Read down a column to compare recent cohorts to older ones at the same point in their journey.
Why it matters: This is the view marketing teams use to set realistic 30/60/90-day targets and to A/B test onboarding flows against an actual baseline, not a guess.

3. Activation funnel with industry benchmarks
The view: Account creation to first purchase to second purchase to third purchase, with the industry benchmark overlaid at every step.
Why it matters: This localizes the leak. A 1st-to-2nd conversion that's 7 points below benchmark is a post-trial experience problem. A 2nd-to-3rd gap is a habit-formation problem, and reward economics are the lever. This view tells you where a marketing dollar will compound versus where it will evaporate.

4. 2nd-to-3rd conversion trend
The view: How quickly guests who've made a second purchase return for a third, within 60 days. Shown as both a point-in-time rate and a trend line.
Why it matters: The 60-day 2nd-to-3rd conversion rate is the cleanest leading indicator of LTV available. It predicts annualized comp-sales contribution within about three months, well before quarterly P&Ls catch up. It also responds fastest to changes in reward design, push timing, and digital UX, which is why Thanx CSMs review it with operators monthly.
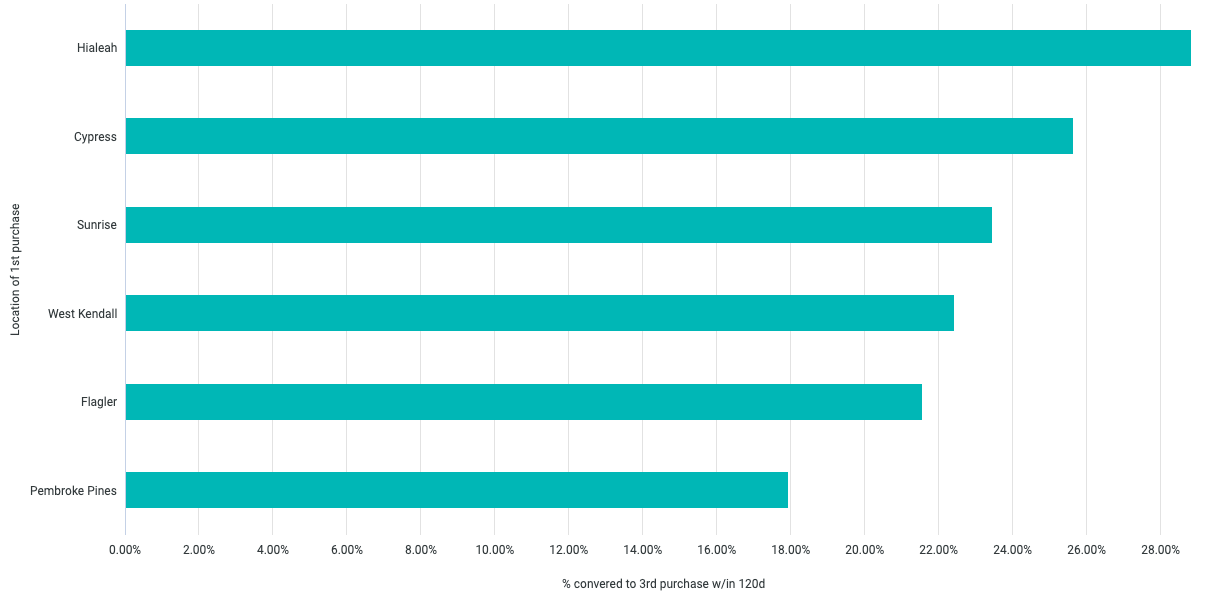
5. Activation Rate by location
The view: Every store ranked by the Activation Rate of guests whose first purchase happened there.
Why it matters: The spread between your top and bottom decile of stores is almost always larger than the gap to the industry benchmark. The biggest available lift often isn't in the marketing department. It's in the field. Stores outperforming on activation are worth studying. Stores underperforming are worth addressing before the pattern compounds.
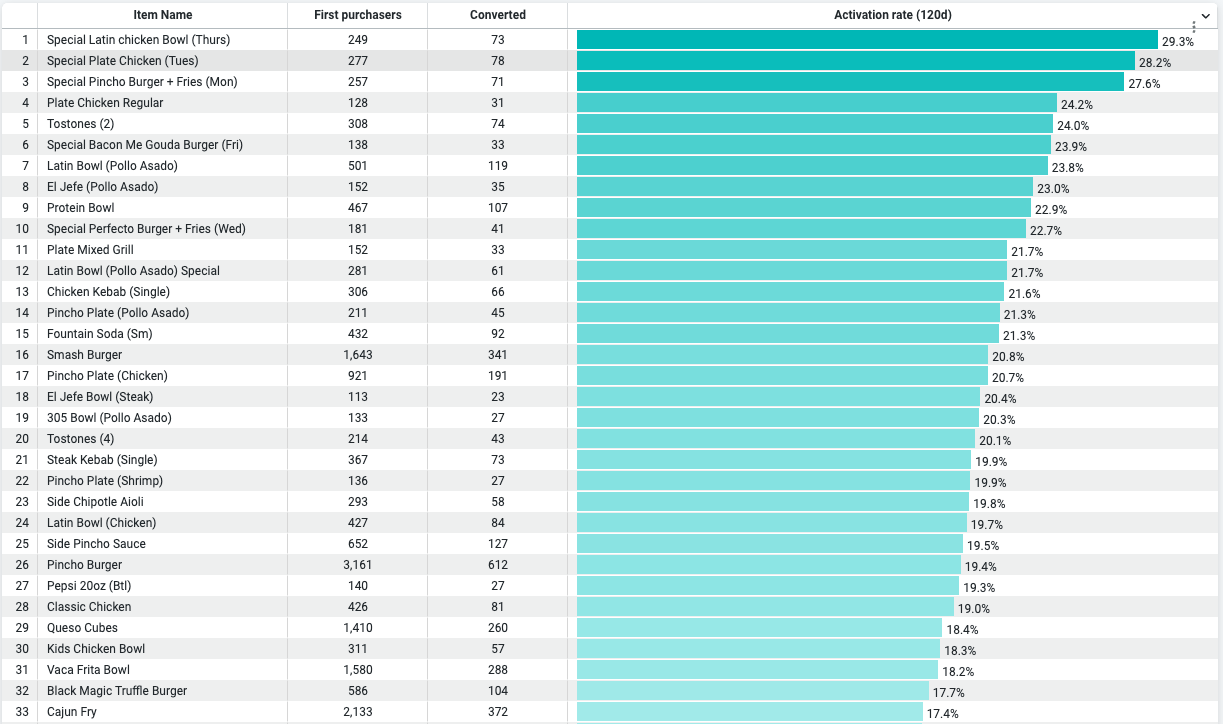
6. Activation Rate by first-basket SKU
The view: For Toast-integrated brands, Activation Rate broken out by the items in a guest's first order.
Why it matters: Some items convert first-time guests into repeat guests at 30%+. Others convert at 15%. That gap tells you which items should anchor first-time-guest promotions and which ones, even popular ones, are quietly ending the guest journey. This is where Activation Rate becomes a menu engineering decision, not just a marketing metric.
Four questions to ask about your brand today
- Do you track Activation Rate at all, as the percentage of new guests reaching a third purchase within 120 days?
- Can you cut it by cohort to see whether activation is getting faster or slower?
- Can you break it out by location and by first-basket item?
- Do you see it against an industry benchmark, so you know whether 22% is strong, average, or quietly broken?
If you can't answer all four, your Activation Rate is being managed by accident.
The brands pulling ahead on same-store sales aren't always acquiring more guests. They're turning the ones they already have into regulars. And they can see exactly where that's working and where it isn't.
See what 5 points of Activation Rate would be worth for your brand.


.avif)
.avif)