


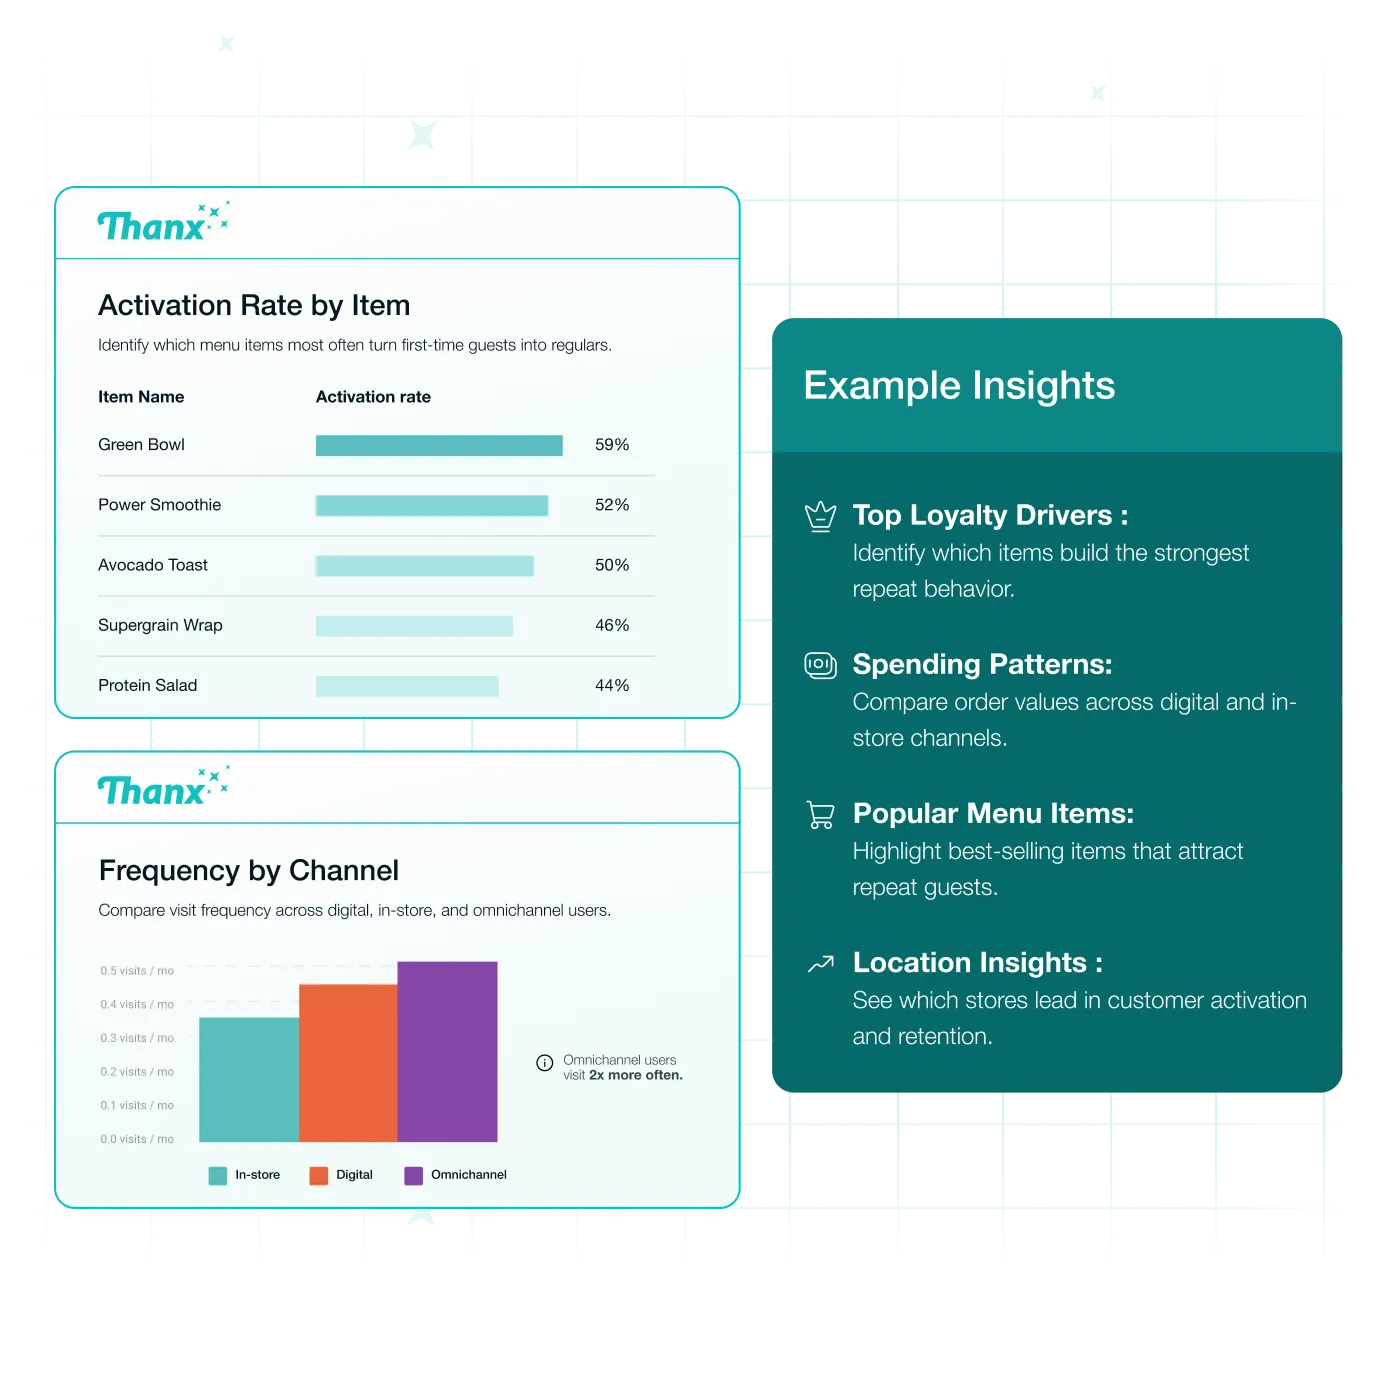
Track activation, retention, signups, and revenue by store with reports like lifecycle funnel by location and activation by location.
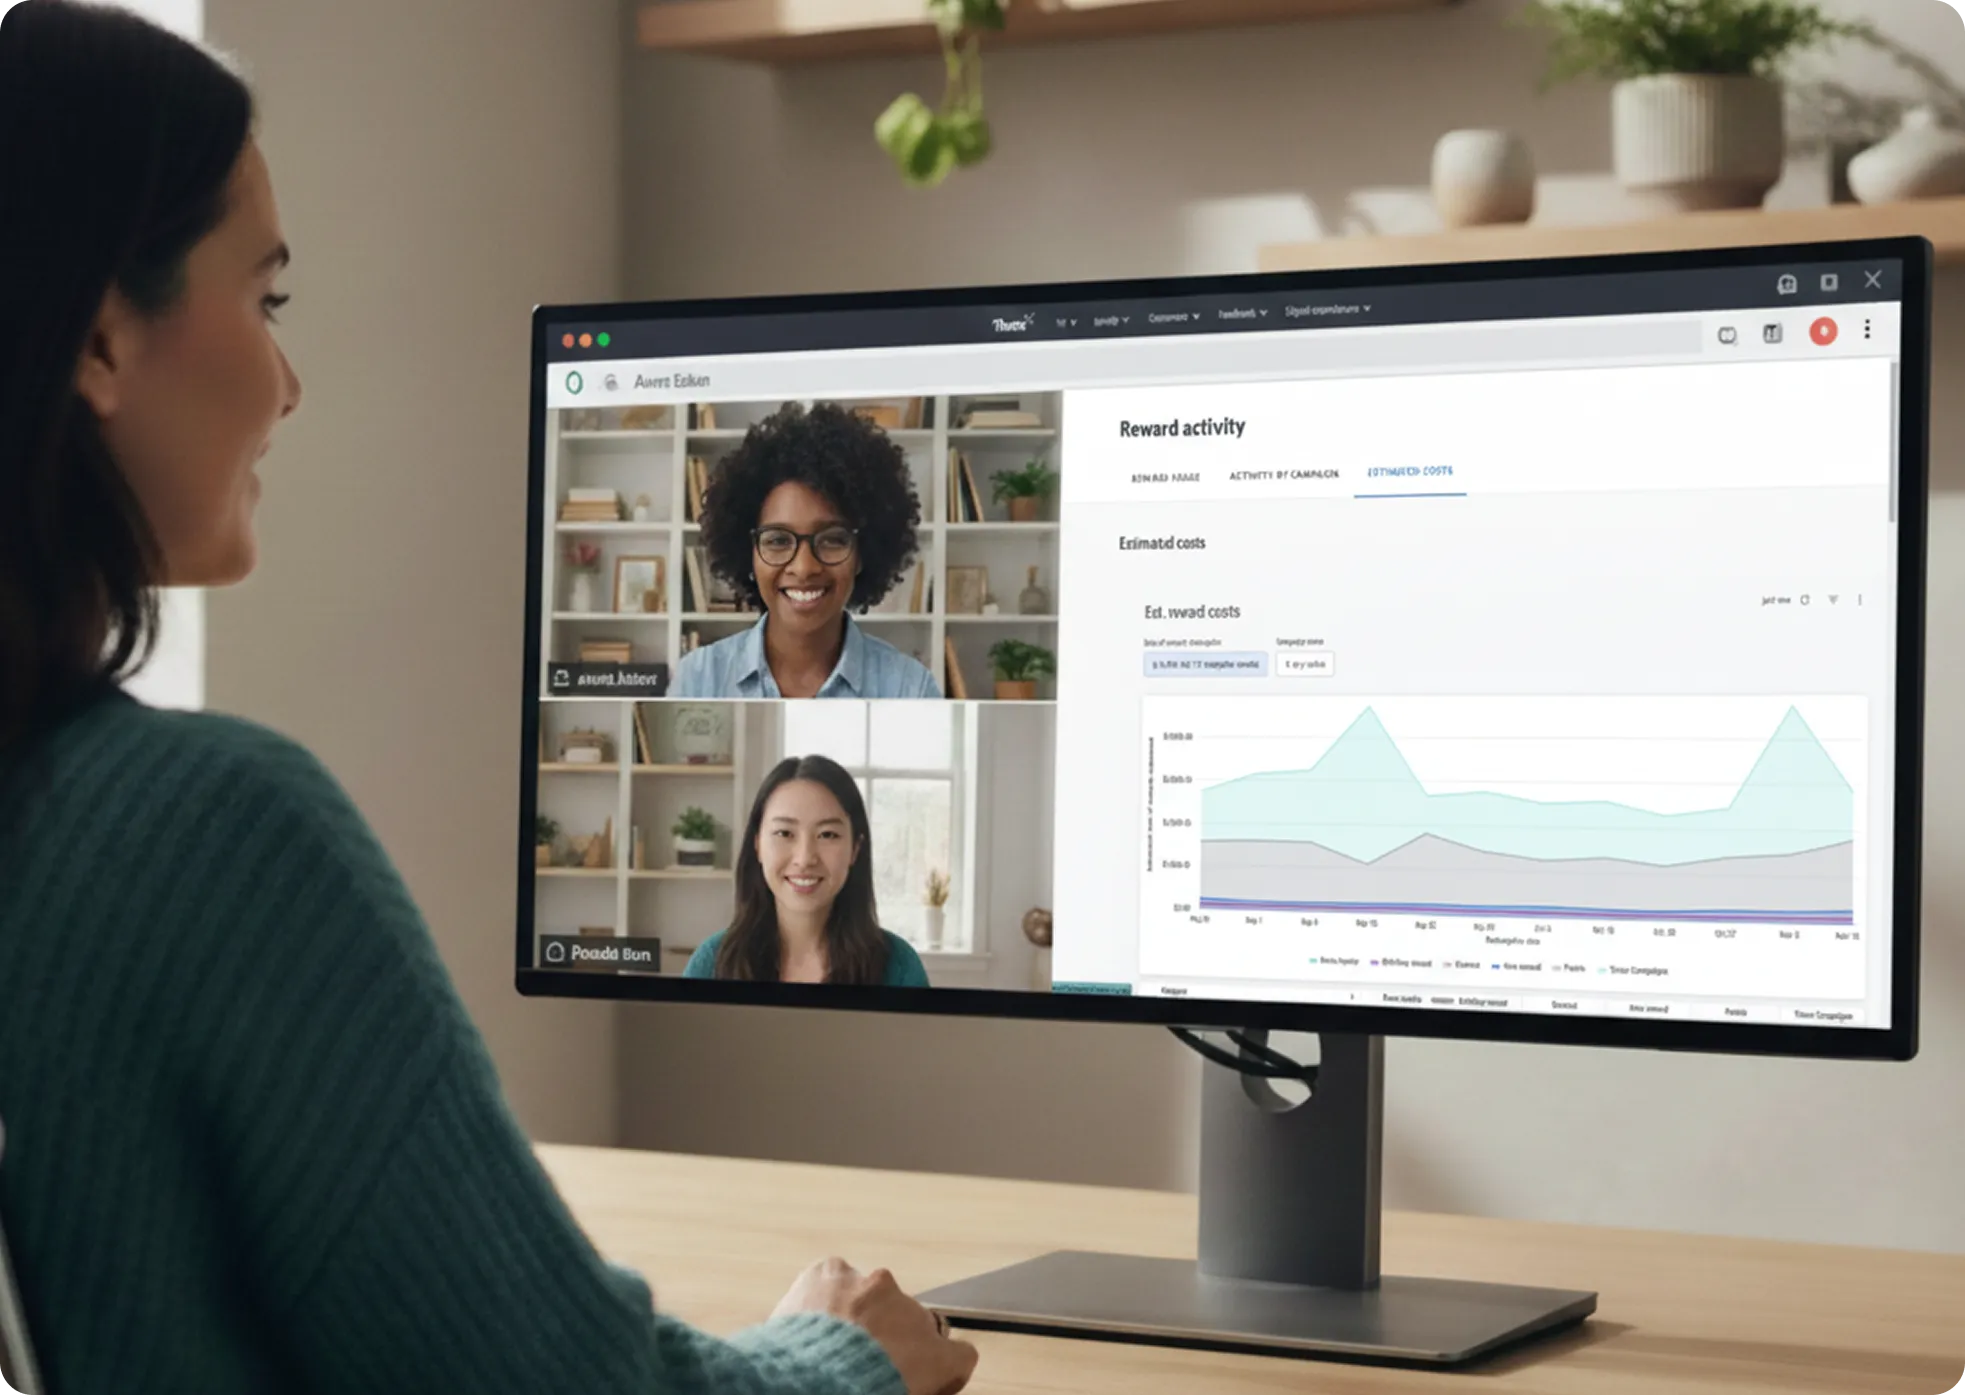
Reporting & analytics
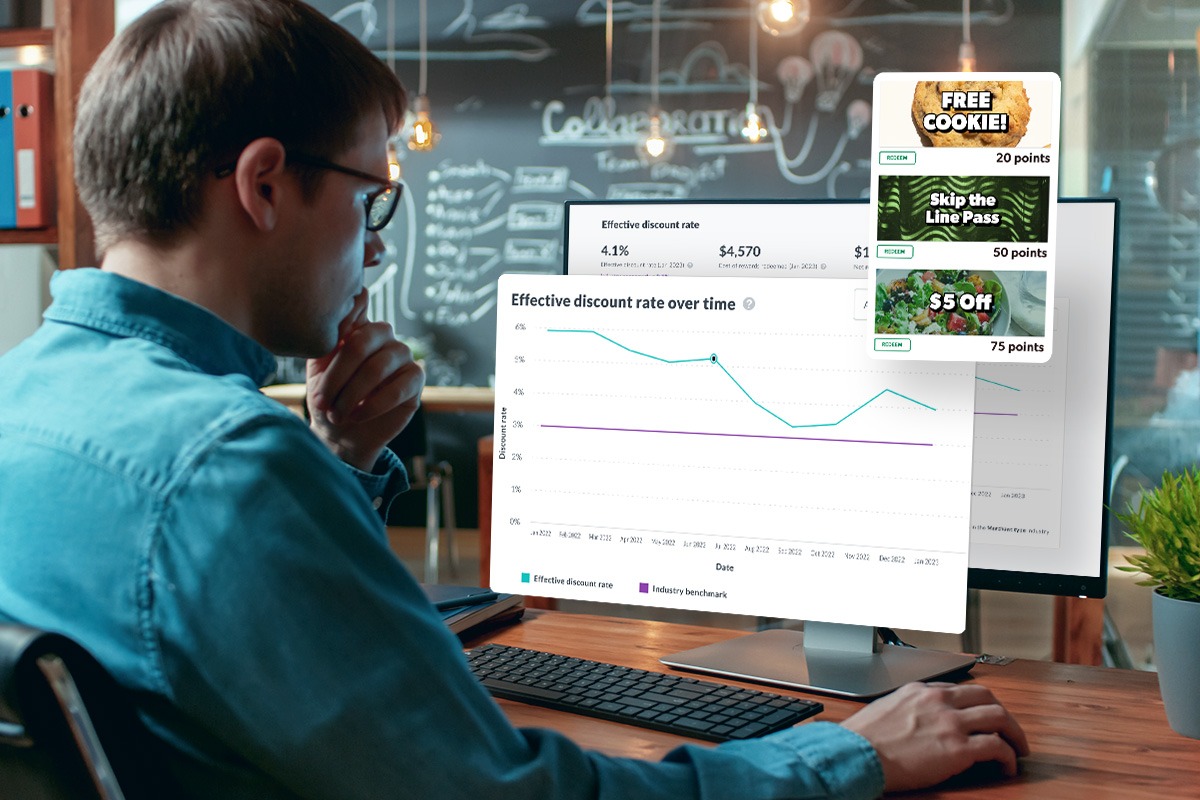
Restaurant reporting software that proves what drives frequency and what doesn't.
Most loyalty platforms hide behind vanity metrics like total signups and member counts. Thanx shows you the metrics that matter.


https://cdn.prod.website-files.com/67ebf334c5ed562314ad1fdc/695c2192312b5af457eea47b_Graphic%202.lottie
https://res.cloudinary.com/dreiso3ix/video/upload/v1764639246/ReportingAnalytics_gprfgi.mp4
.avif)
Proven results
Our restaurant reporting system reveals what actually drives business results.
Legacy platforms stop at activity reporting. Thanx reveals whether your program drives real business outcomes—and shows you exactly what to do next.

Thanx restaurants see an average of:
Reports available directly in our dashboard
100+
Reporting latency
<1 hour
Industry benchmarks available in the dashboard
15
See how it works
Detailed reports organized around strategic questions
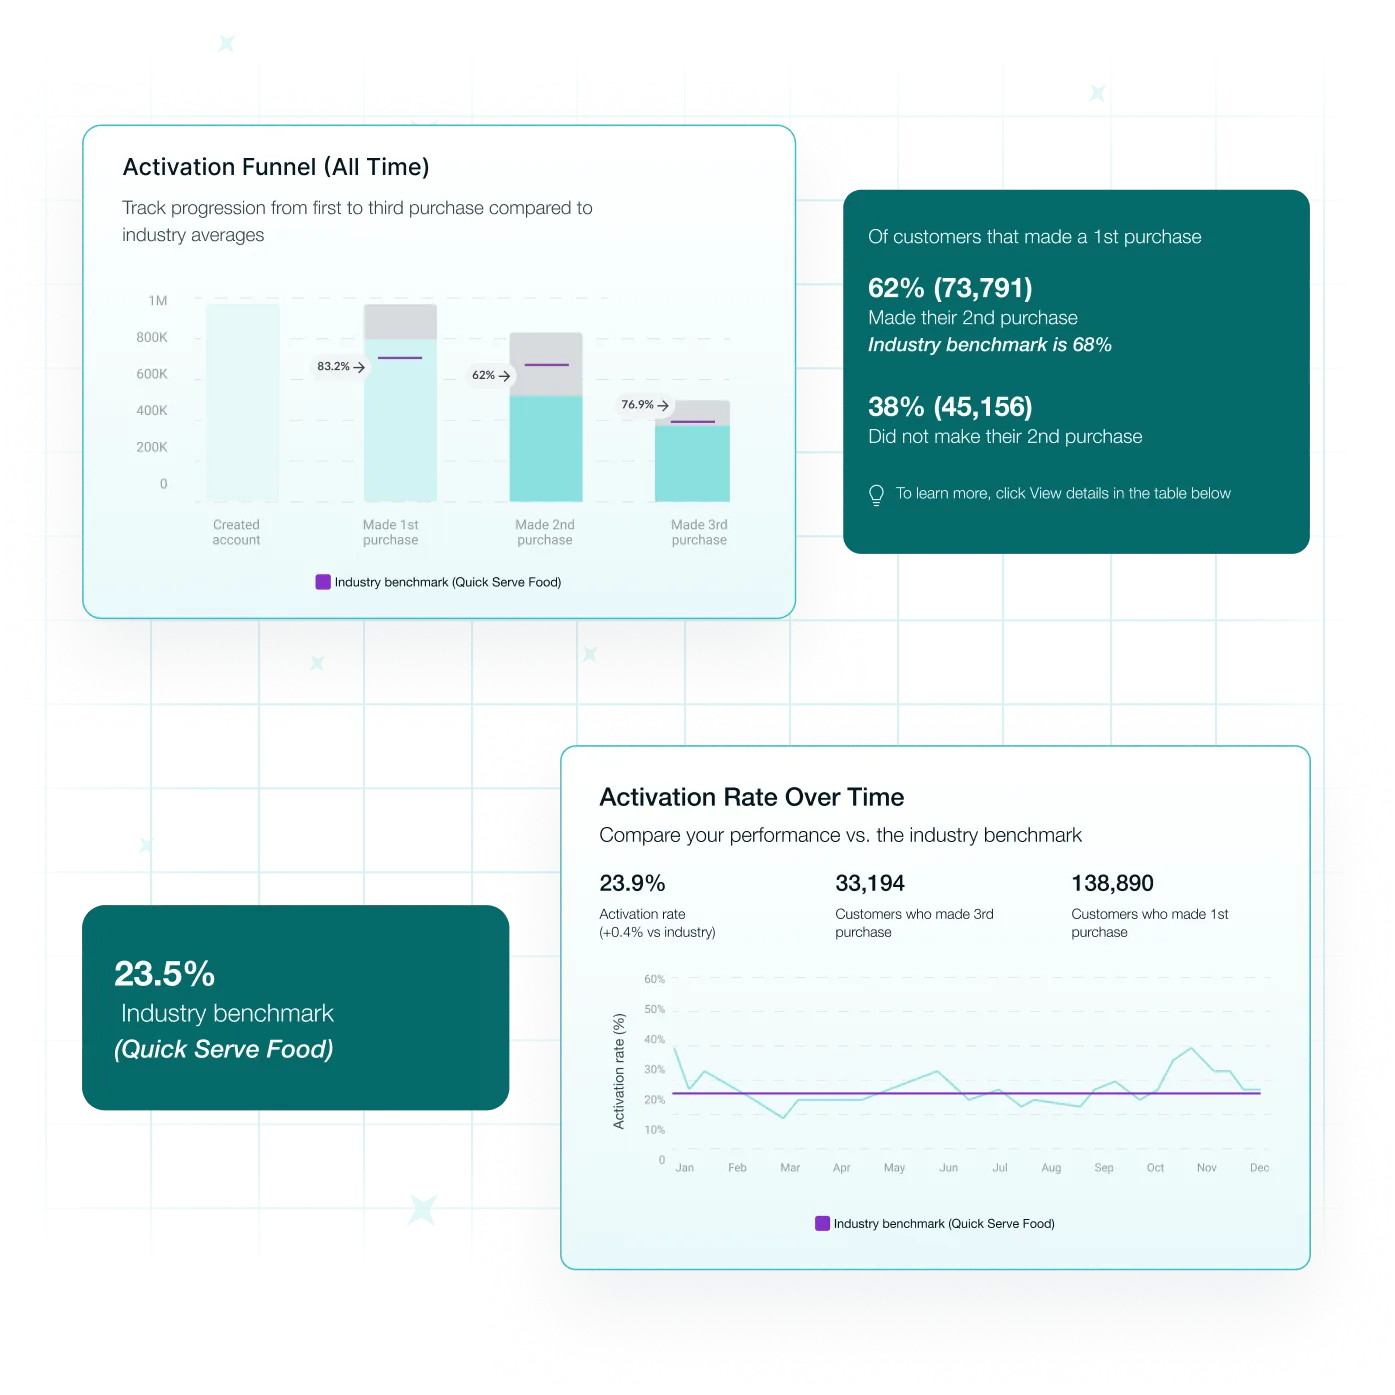
Thanx reporting helps restaurants make smarter decisions with metrics tied directly to customer satisfaction and business outcomes. Every report answers a specific strategic question.
Interactive reports
Get answers instantly, without a data team
This is some text inside of a div block.
Expert guidance
Get proactive guidance from our Chief Data Officer (CDO)
Customer success stories
Restaurant analytics wins.
It's great to have a partner like Thanx who quite literally proactively scheduled an office hours session with us to talk about our data. That was not something I even asked for. The value of that type of partnership is hard to overstate.
Angela Zoiss, CMO | Bottleneck Management Restaurant Group
$335K
Revenue growth from reward members YTD
200%
Sign-up growth in each of three consecutive months
38%
First purchase tracking increase vs. last year
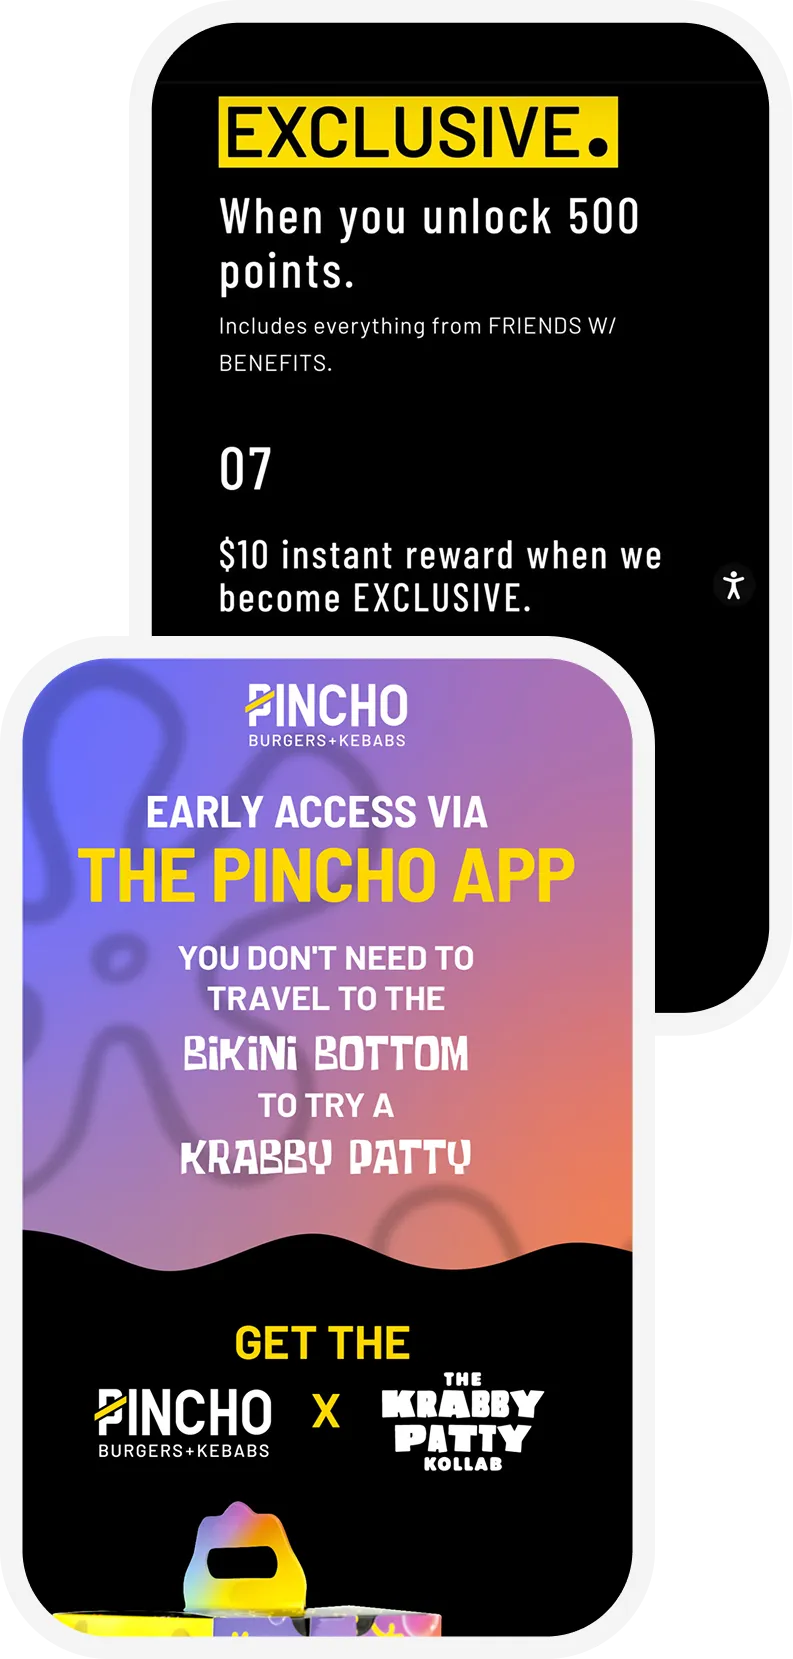
Next up: PINCHO
.avif)
.svg)
Restaurant reporting software beyond the basics.
Thanx delivers accurate reporting across 100+ reports—from fraud detection to margin protection—so you can make smarter decisions about your loyalty program's ROI.
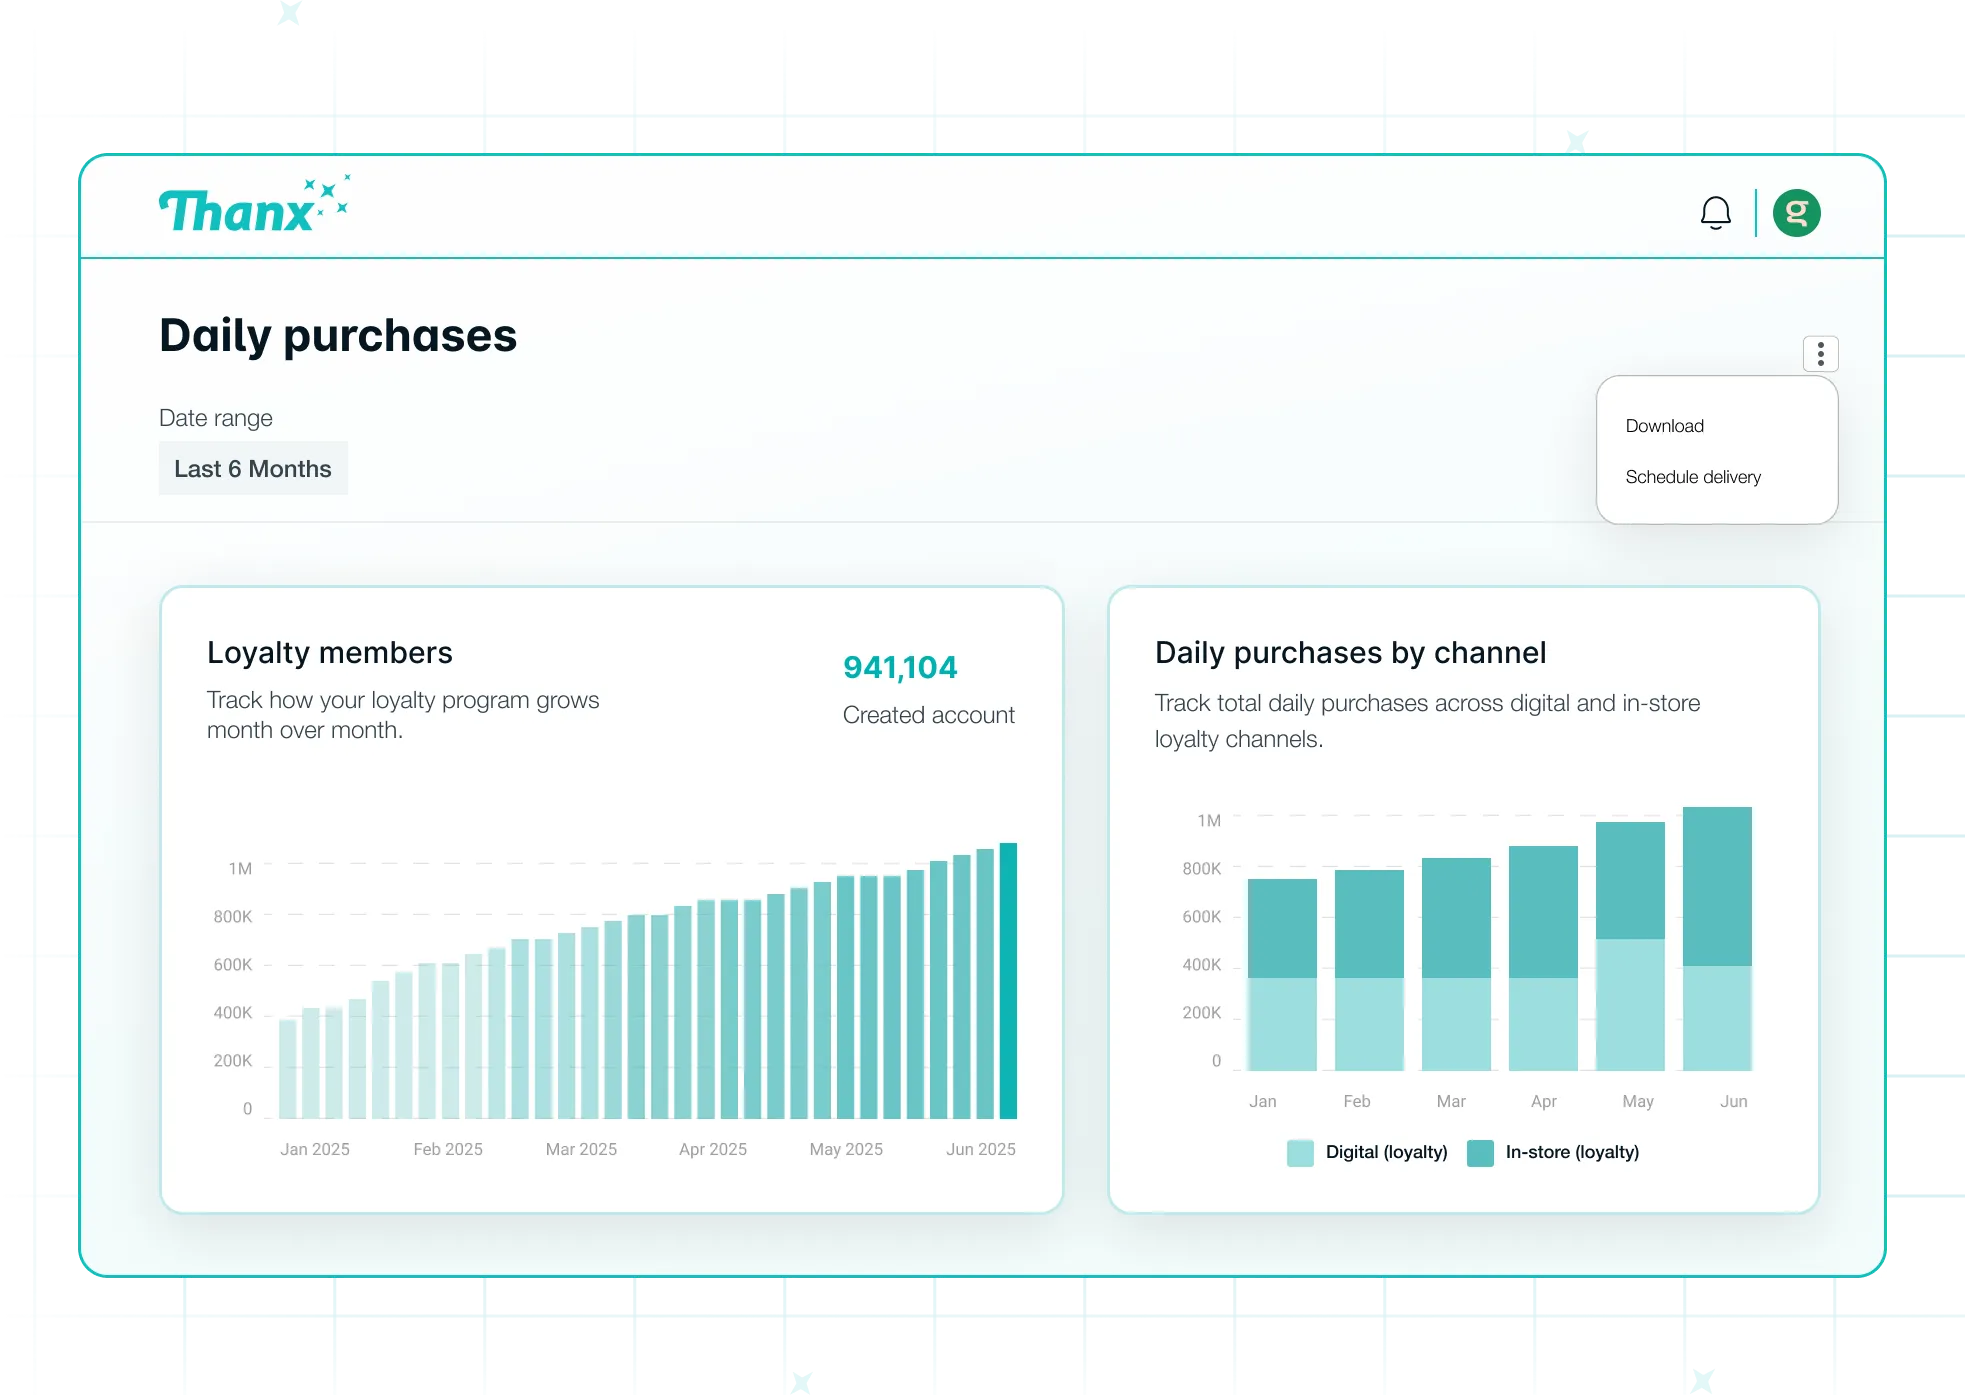
Performance by location
Understand what drives behavior
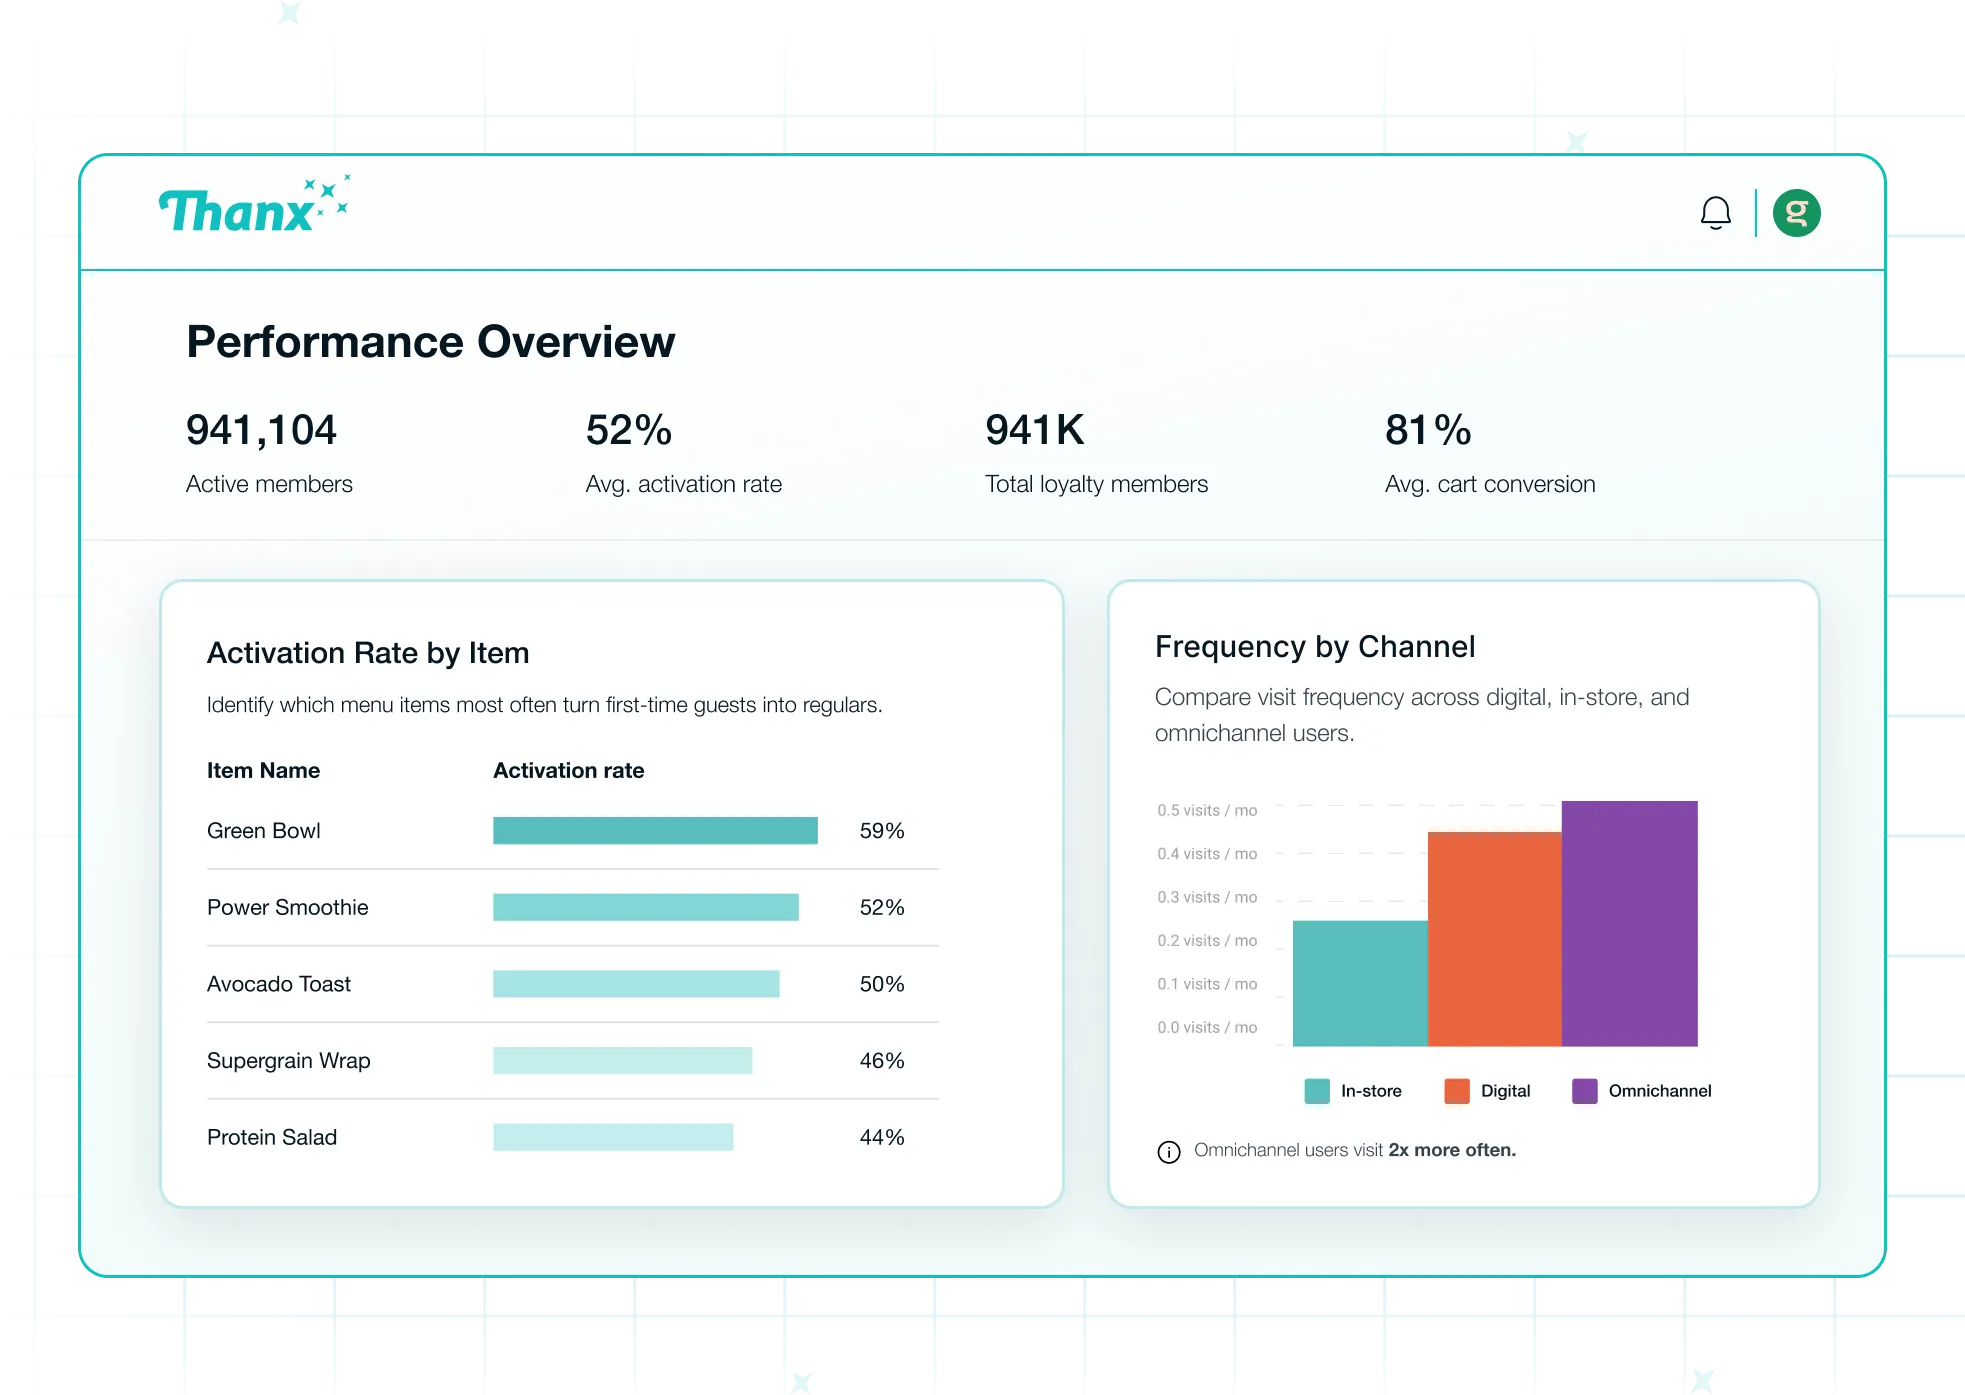
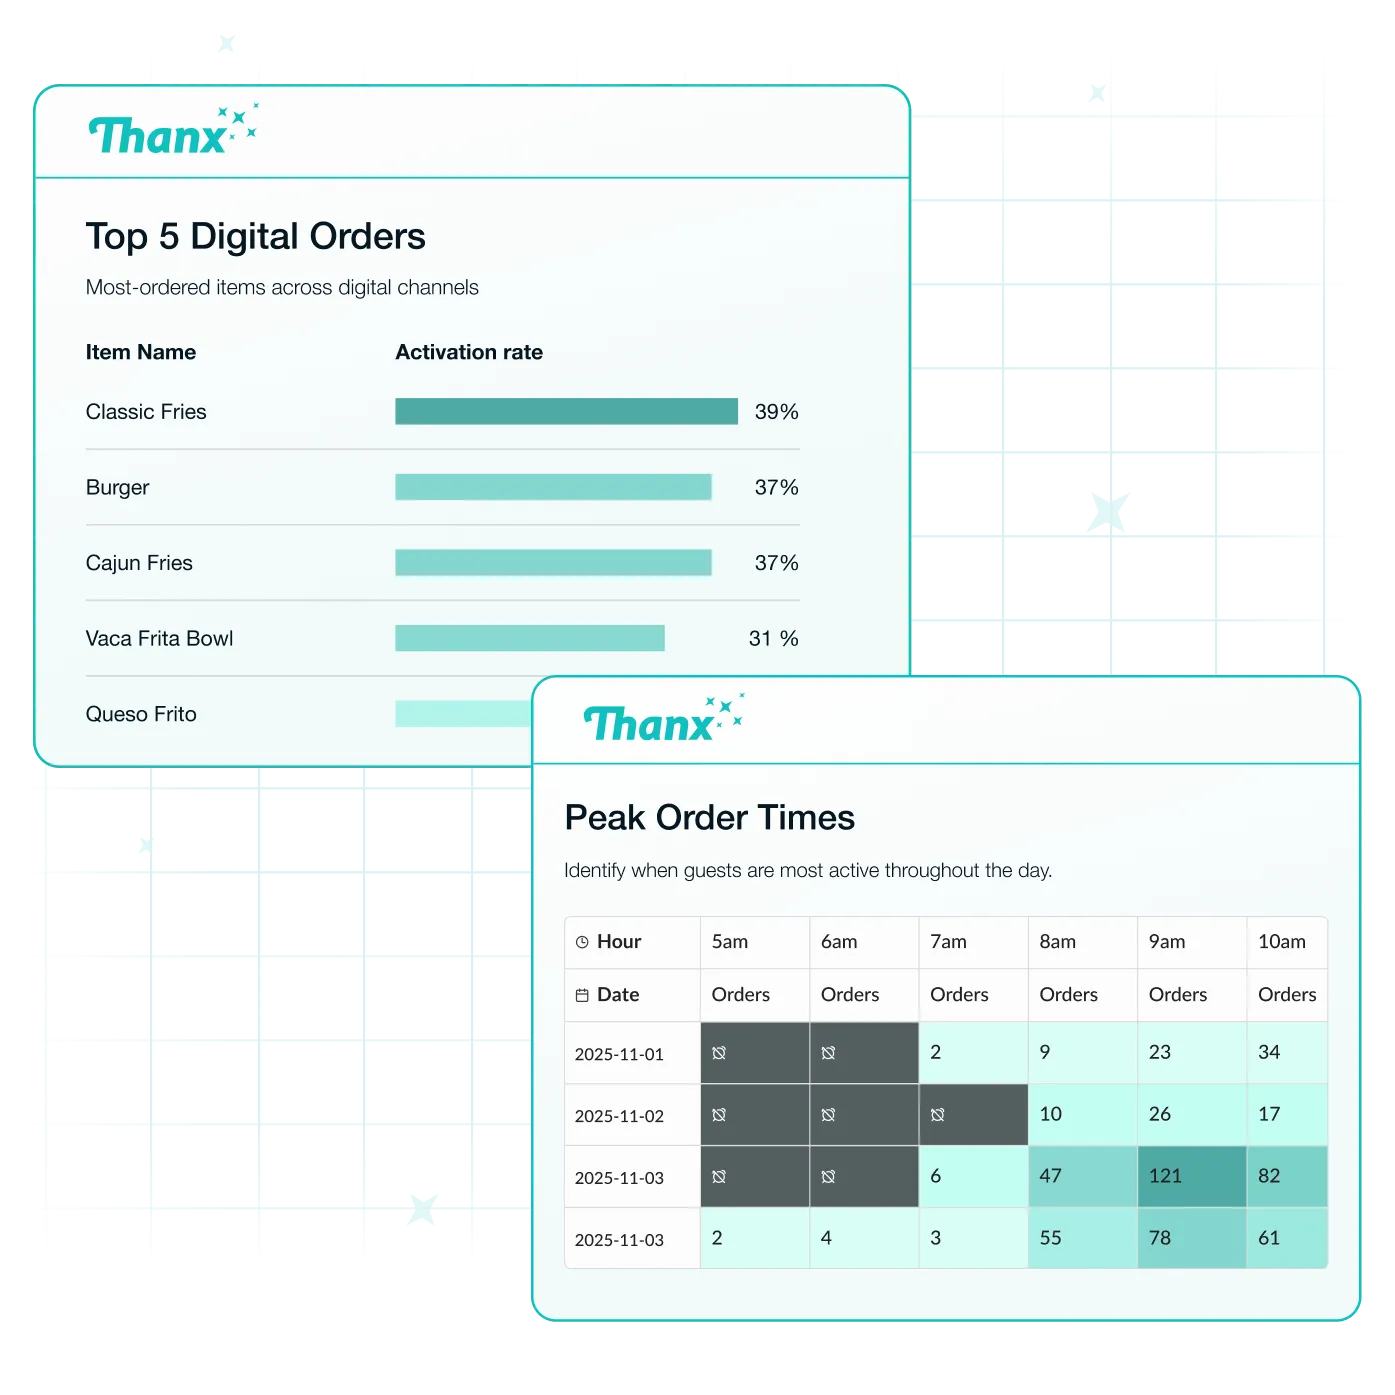
See which menu items and rewards resonate most with reports like item popularity across all channels and activation rate by SKU.
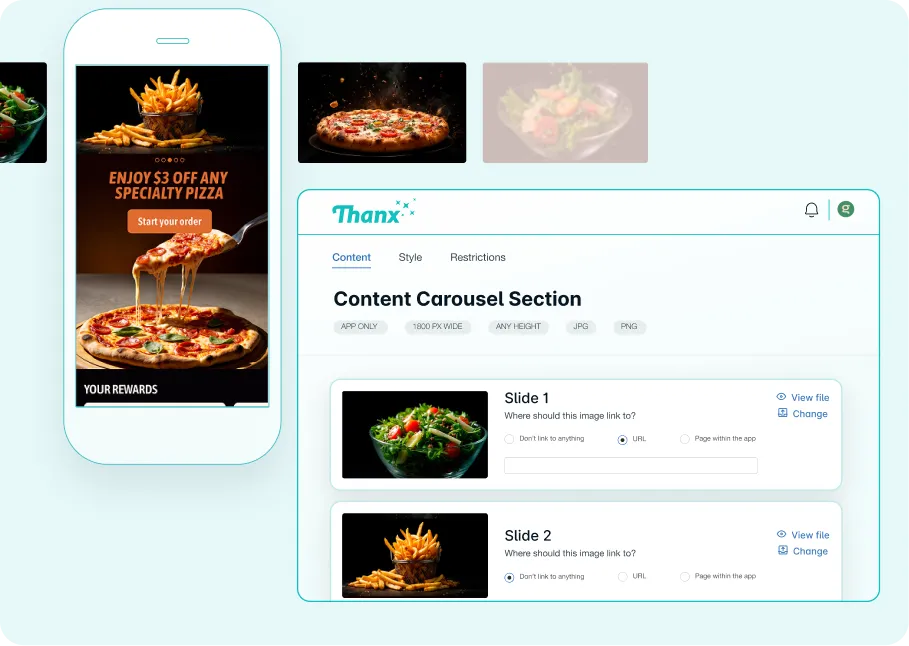
Optimize every message
Track email health, engagement by campaign type, and opens by hour to improve deliverability and timing.
Tie loyalty directly to revenue
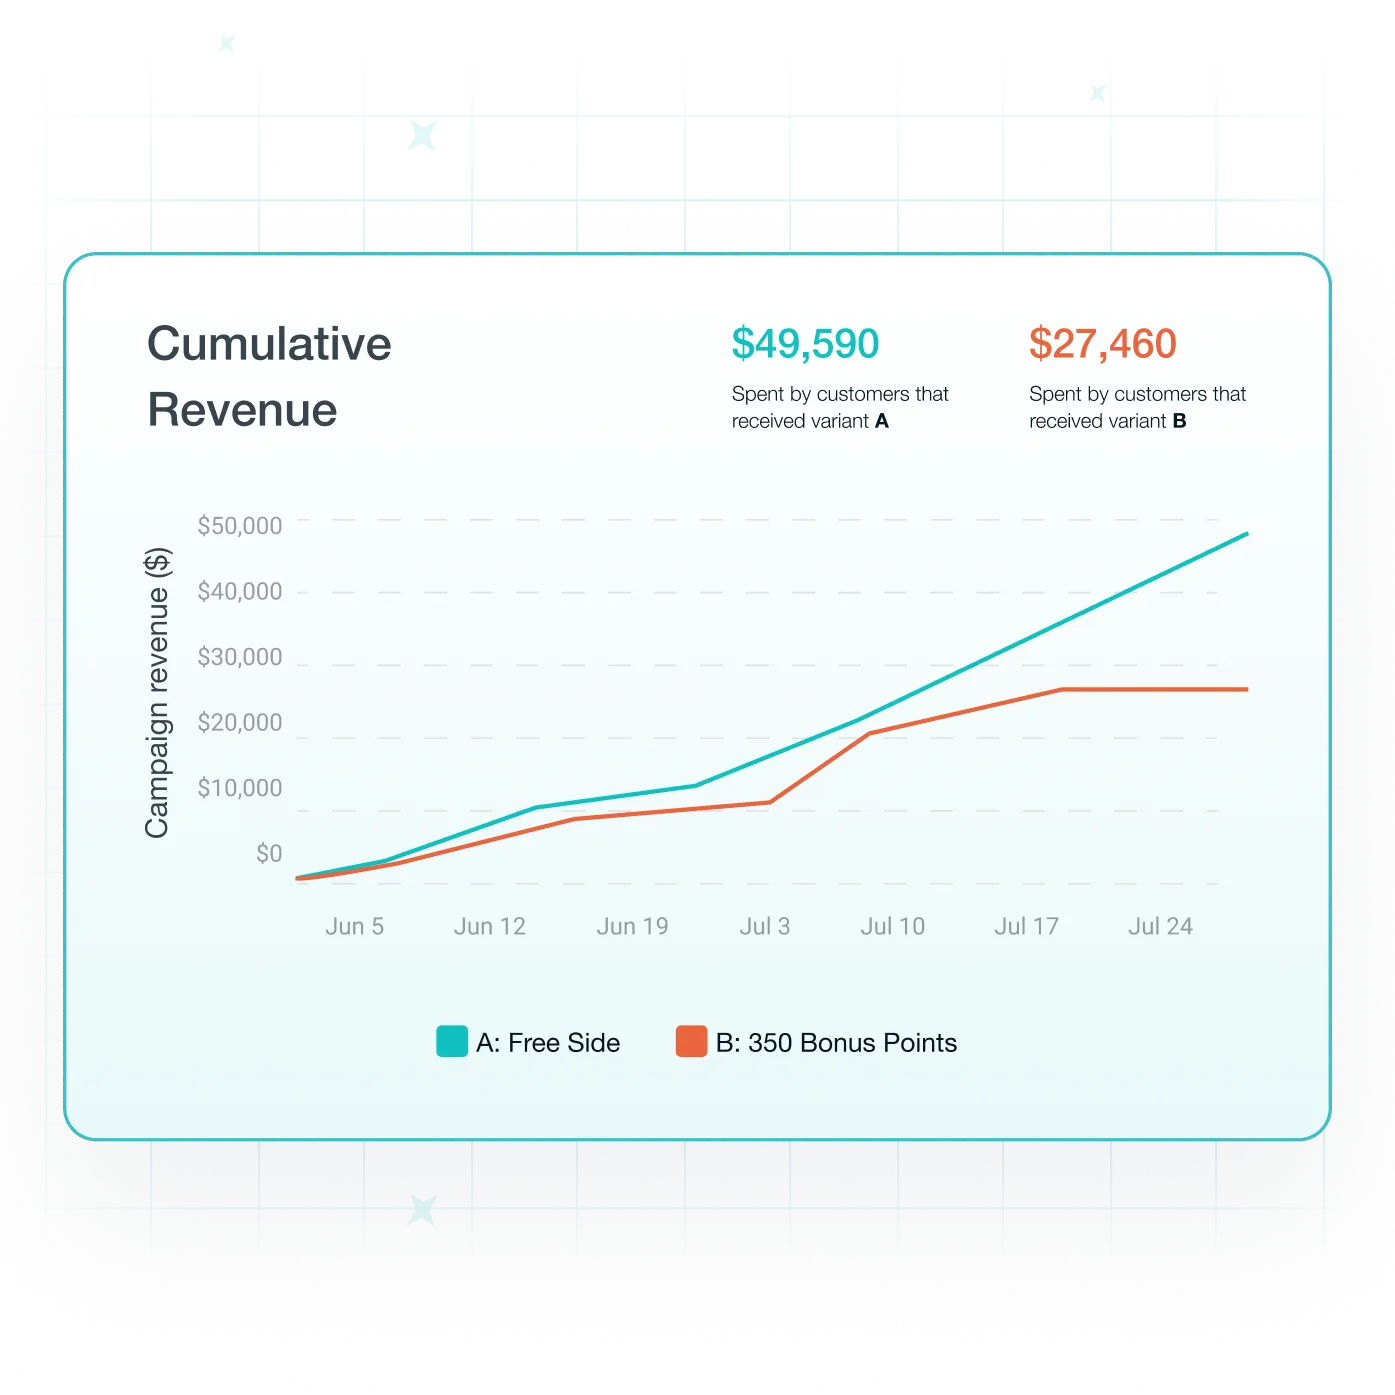
Isolate loyalty-driven revenue from baseline performance with transparent, trustworthy attribution and ROAS vs ROI reporting.
Protect your program integrity
Monitor suspicious activity and prevent abuse to protect margins with reporting on fraud detection and cost control.
See how guests engage
Analyze orders by hour of day, channel preference, and handoff mode to understand how your guests prefer to order.
%20(2).avif)


Reporting & analytics
Real-time data and insights for every aspect of your guest engagement program.
Make data-driven decisions with 100+ pre-built reports organized by strategic need, from operational health to campaign ROI to menu performance.
Monitor system activity

Elevate your strategy
Prove your impact
Menu & behavioral insights
Benchmark your performance
Explore more
More than reporting—key insights that drive action.


FAQ
Answers to commonly asked questions.
What is restaurant reporting software?
Restaurant reporting software tracks performance data to help operators make informed decisions. There are two main types: business intelligence (BI) platforms like Tableau or Looker that connect to multiple data sources across your tech stack, and SaaS platforms that provide reporting on the data they contain—like POS systems reporting on transactions or loyalty platforms reporting on member activity. Both serve different needs. BI platforms offer flexibility if you have proven data resources, while SaaS platforms provide ready-to-use reporting on specific areas.
Thanx is a SaaS platform focused specifically on customer data and loyalty program performance. We organize 100+ reports around strategic questions rather than just surfacing raw data: Is your program healthy? What's driving repeat visits? Which campaigns deliver real ROI? Our restaurant reporting software updates within an hour and includes built-in industry benchmarks, transparent methodology, and access to our Chief Data Officer during office hours—so you get answers, not just dashboards.
What are the key features of restaurant reporting software?
The key features depend on whether you're using a business intelligence platform or a SaaS platform. BI platforms offer flexibility to pull data from anywhere, but require technical expertise to build custom dashboards. SaaS platforms provide pre-built reports on the data they collect, like POS systems showing transaction patterns or ordering platforms showing digital sales. Both approaches work; it's about what fits your team and needs.
For customer-focused restaurant reporting software, the must-haves are strategic metrics (not just activity counts), timely updates so you can act quickly, and context that helps you understand what to do next. Thanx delivers all three. We track metrics tied to business outcomes (activation rate, retention rate, effective discount rate, and capture rate), not vanity metrics like total members. You can filter, schedule, download, and share reports on demand without waiting for a data team. And we include video tutorials explaining how each metric is calculated, plus 25 industry benchmarks, so you can see whether your performance is strong or needs attention.
What are some popular restaurant reporting software options?
Most restaurants piece together reporting from multiple locations: POS systems for transaction data, ordering platforms for digital sales, and loyalty providers for member activity. Some use standalone BI tools to consolidate everything, which works well if you have the resources to build and maintain custom dashboards. Legacy loyalty providers offer reporting, but it's often focused on activity rather than outcomes (you see what happened without understanding what to do next).
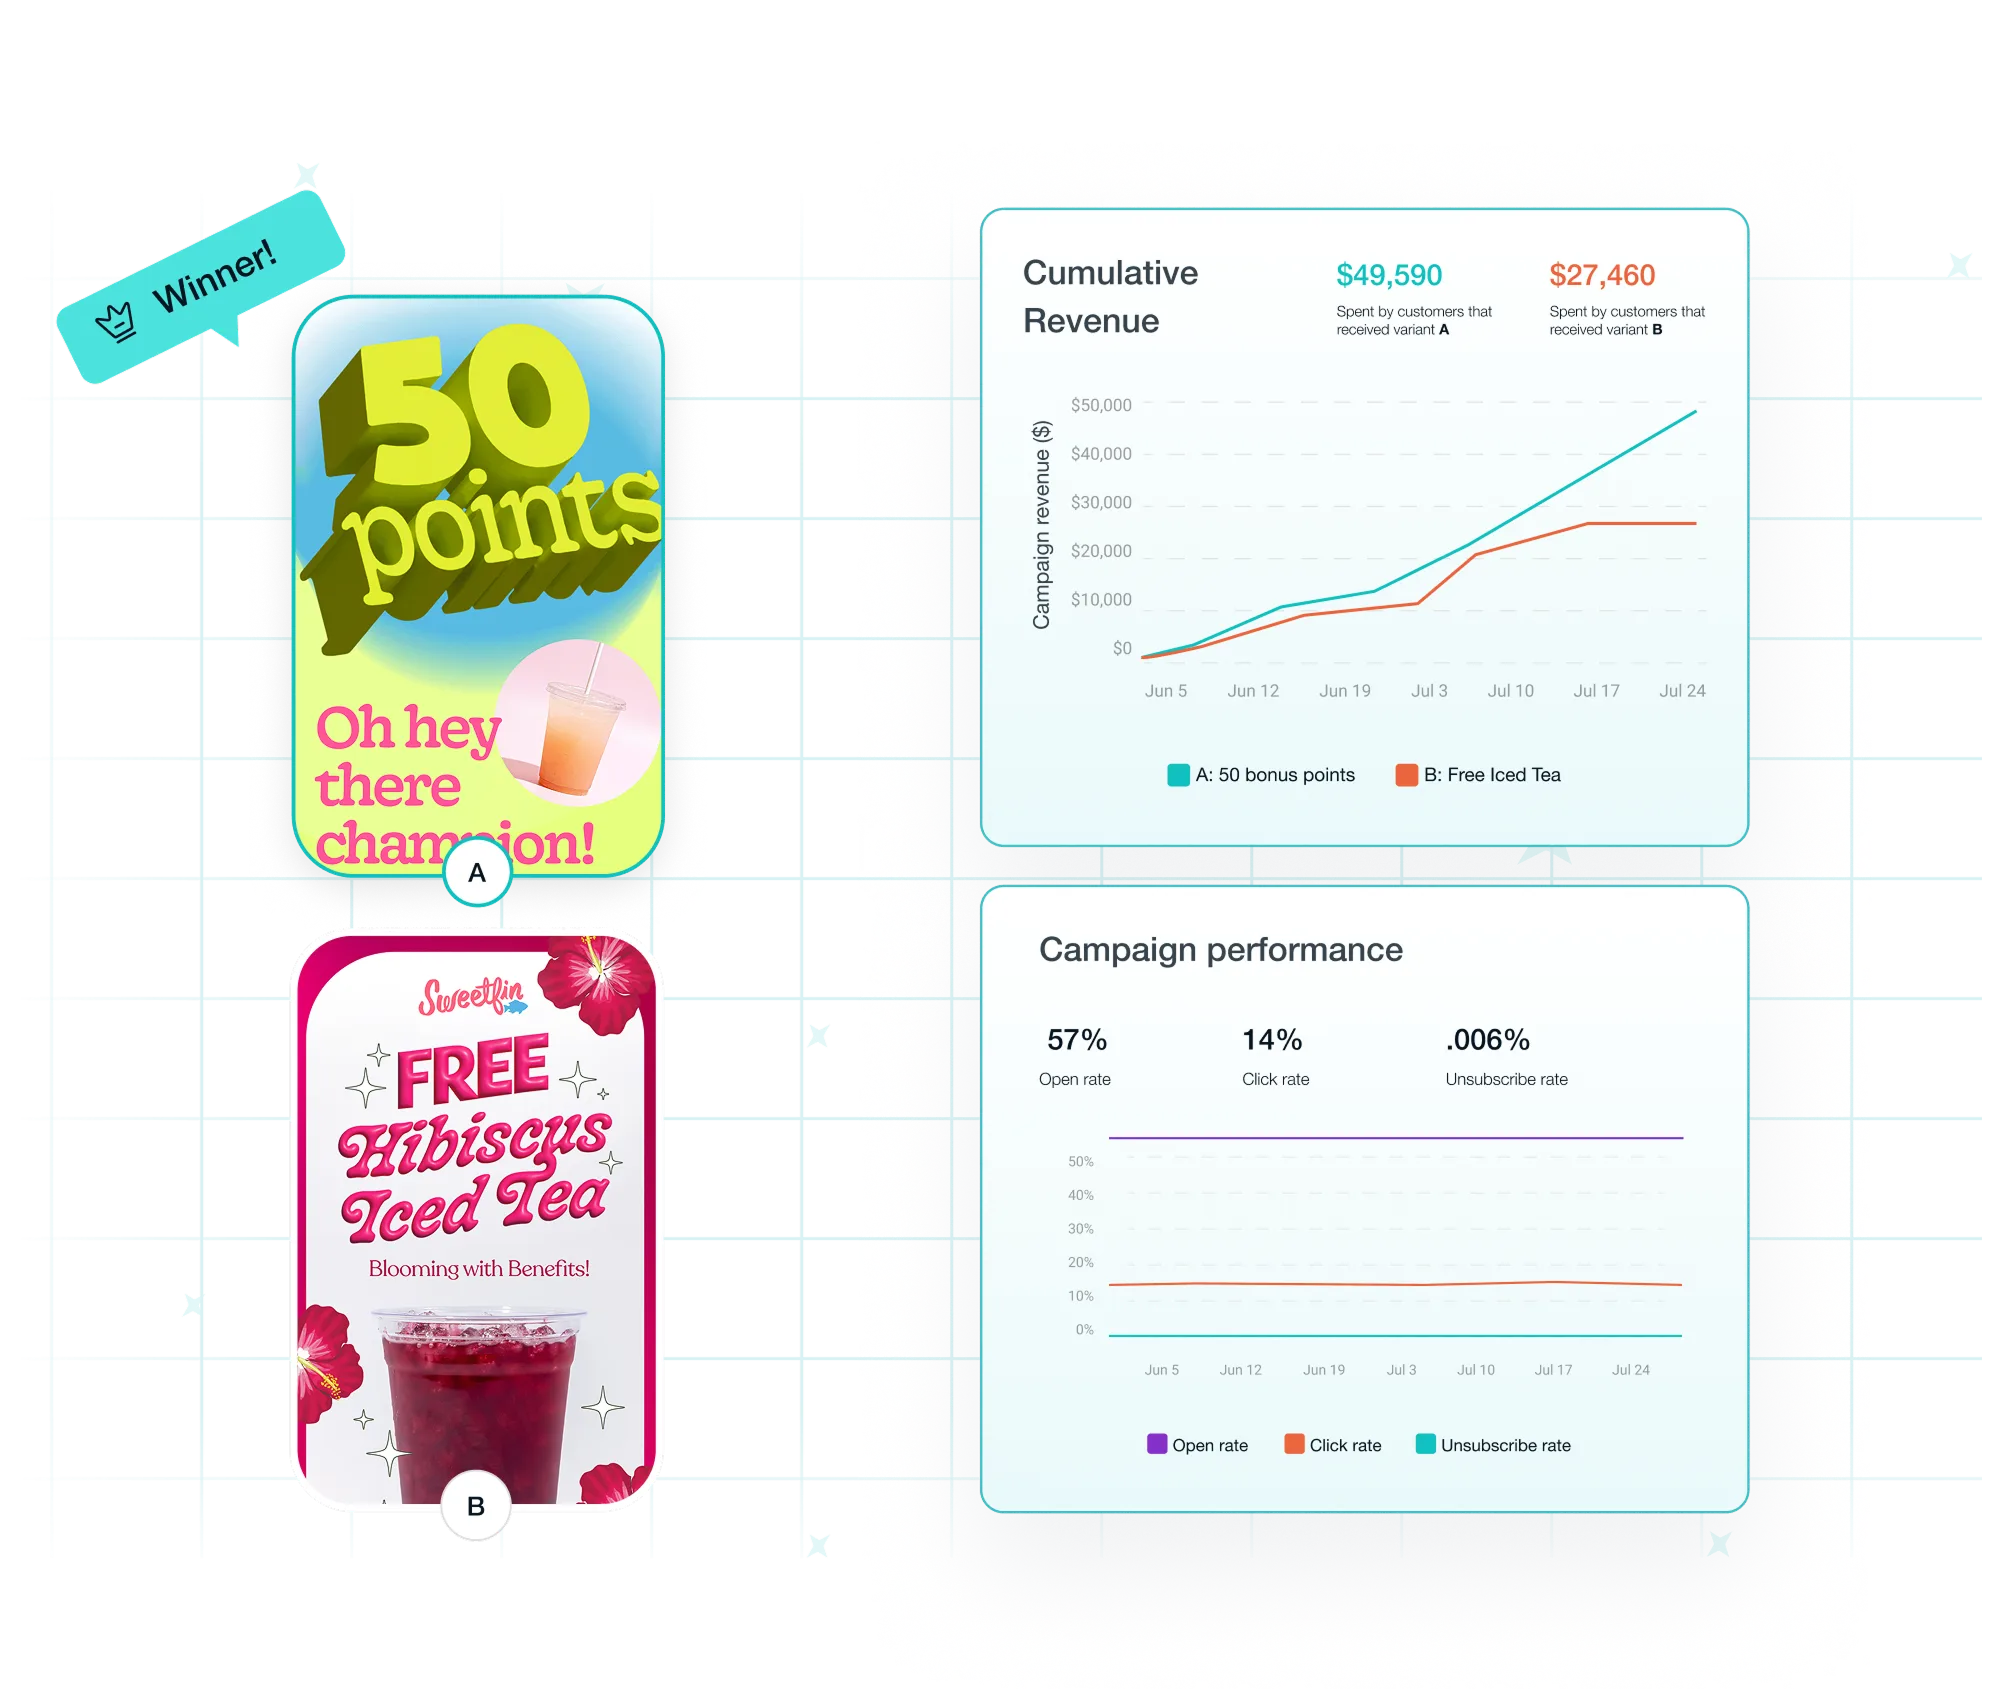
Thanx is purpose-built for restaurants that want to understand customer behavior and prove loyalty ROI. We don't just show you what happened; we organize reporting around strategic questions and provide the context to take action. You get built-in control groups to measure incremental lift, one-click A/B testing to optimize campaigns, and transparent attribution that isolates loyalty-driven revenue from baseline performance. Plus, our reporting updates within an hour, so you can spot issues before they escalate and adjust campaigns while they're still running. That level of speed and strategic focus doesn't exist with generic restaurant tech tools.
How does restaurant reporting software help track campaign ROI?
Most restaurants piece together reporting from multiple locations: POS systems for transaction data, ordering platforms for digital sales, and loyalty providers for member activity. Some use standalone BI tools to consolidate everything, which works well if you have the resources to build and maintain custom dashboards. Legacy loyalty providers offer reporting, but it's often focused on activity rather than outcomes (you see what happened without understanding what to do next).
Thanx is purpose-built for restaurants that want to understand customer behavior and prove loyalty ROI. We don't just show you what happened; we organize reporting around strategic questions and provide the context to take action. You get built-in control groups to measure incremental lift, one-click A/B testing to optimize campaigns, and transparent attribution that isolates loyalty-driven revenue from baseline performance. Plus, our reporting updates within an hour, so you can spot issues before they escalate and adjust campaigns while they're still running. That level of speed and strategic focus doesn't exist with generic restaurant tech tools.
How does restaurant reporting software help track campaign ROI?
Most restaurant tech tools show campaign activity (emails sent, rewards issued, opens, and clicks), but they don't prove whether the campaign generated incremental revenue. You're left guessing if it was worth the investment, especially when you're trying to justify loyalty spend against other priorities like food costs or labor costs.
Thanx tracks true ROI by measuring incremental lift with built-in control groups. You see exactly how much revenue a campaign generated beyond what would have happened anyway. We tie every campaign directly to revenue and engagement with transparent attribution, and you can run one-click A/B tests to optimize messaging, rewards, timing, and audience. Our reporting breaks out performance by location, lifecycle stage, and channel, so you know not just whether a campaign worked, but where it worked and why. This level of detail helps you shift spend away from blanket discounts (which hurt margins) and toward targeted rewards that maximize profitability.
Can I trust the data in restaurant reporting software?
This is one of the biggest problems with reporting across the restaurant industry: data inconsistencies erode trust. When numbers don't match between your POS, ordering platform, and loyalty provider, or when reports update on different schedules, you stop relying on the data to make decisions. One customer told us they finally switched because they "couldn't trust the reporting" from their legacy provider.
Thanx solves this by making data accuracy and transparency core to how we build reports. Every metric includes clear documentation of the methodology so you understand exactly what you're seeing and how it's calculated. We update reports within an hour, so there's no confusion about data lag. You can validate performance against 25 industry benchmarks to confirm your results make sense. And you have direct access to our Chief Data Officer during office hours to ask questions and explore your data with experts. When reporting is accurate, transparent, and supported by a team that helps you interpret it, trust stops being an issue.
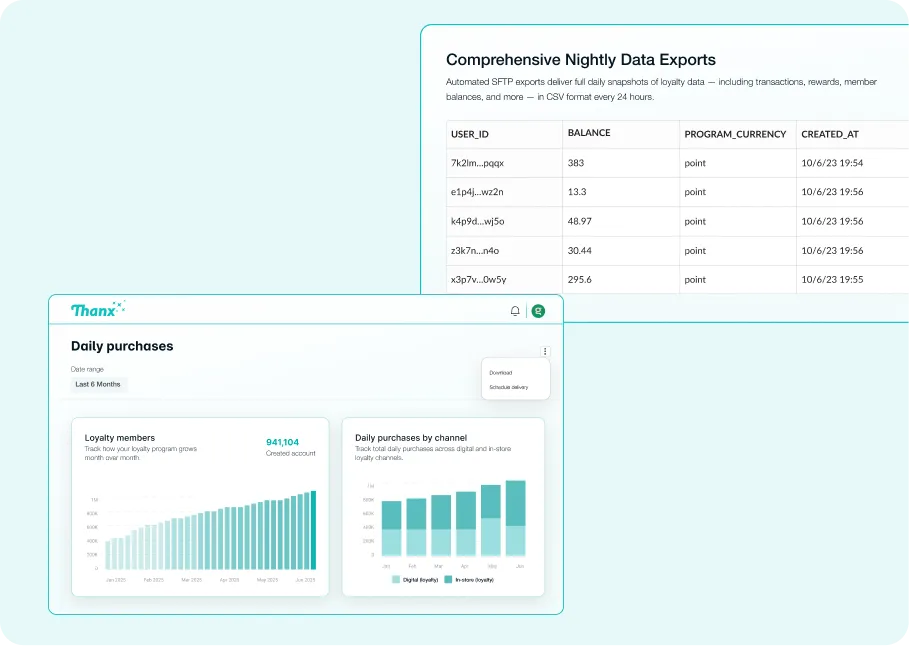
Does Thanx integrate with other analytics tools?
Yes, and this is particularly valuable if you want to combine customer and loyalty data with broader operational and financial insights. Thanx integrates with downstream analytics providers that specialize in creating unified business intelligence across your entire restaurant tech stack.
These providers pull data from Thanx alongside your POS, labor management, inventory systems, and accounting platforms to build custom analytics solutions. This means you can analyze how loyalty member behavior impacts food costs, labor efficiency, menu mix, and overall profitability—all in one place. If you already use a downstream analytics provider or want that level of integrated reporting, Thanx makes it easy for partners to connect to our platform.
.avif)
.avif)