

.avif)

The traditional dining out experience has changed. Consumers are trading tables and waitstaff for living room couches and to-go boxes. Fueling the change is a stream of third-party delivery apps that give consumers the ability to fulfill their every craving with a few swipes on their phone.The online ordering craze is even shaping brick-and-mortar establishments. Restaurants are leasing less space as fewer customers dine-in, and they're setting up “delivery stations” that give drivers easy in-and-out access to expedite the delivery process, explains Ad Age.Given this delivery boom, what should restaurant owners know about delivery? Here’s a look at 15 delivery statistics to consider, especially if you’re trying to decide if delivery is right for your business.
How fast is restaurant delivery growing?
Fast. The number of delivery app downloads is increasing and so are sales. Here’s a snapshot of statistics that show just how quickly delivery is growing.
- Digital ordering and delivery have grown 300% faster than dine-in traffic since 2014.
- The number of food delivery app downloads is up 380%, compared to three years ago.
- 86% of restaurant consumers are using off-site delivery services at least monthly.
- The third-party food delivery market, which includes the delivery of both restaurant meals and groceries, is expected to reach $24.5 billion by 2022.
What age groups are ordering takeout online?
As you might expect, the younger generation is a big fan of ordering food with their smart devices, but text-happy millennials aren’t the only ones making paper menus and phone calls extinct. Have a look:
- 55% of 18-24-year-olds have placed at least one online delivery order in the last year, followed by:
- 49% of 25-34 year-olds
- 40% of 35-44 year-olds
- 33% of 45-55 year-olds
- 26% 55-64 year-olds
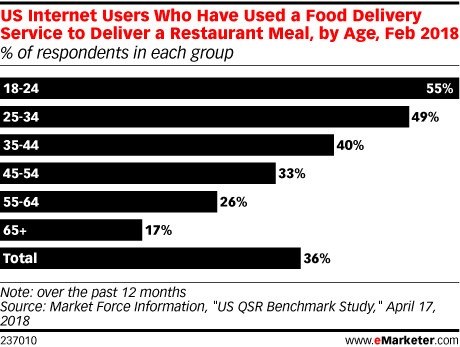
Chart: eMarketer
Which restaurant app is the most popular?
Ordering food via an app has never been easier (heck, we even have an online ordering integration), but customers have a plethora of choices when it comes to food-ordering apps. Some restaurants have their own ordering platform while other third-party sites like Grubhub and DoorDash have gained a lot of users. Here’s a look at app-ordering popularity:
- 52% of customers use specific restaurant apps for ordering.
In 2017, the majority of customers downloaded and used a specific restaurant’s app or website to order food. In 2017, Grubhub and UberEats were actually less popular than ordering from restaurant-specific sites.

Chart: eMarketer
- 48% of consumers use Grubhub, but DoorDash is a dark horse.
Some restaurants use a third party app for delivery, like Grubhub or UberEats. In the chart above, you can see Grubhub had a strong market share in the industry, which has only grown since it acquired Eat24 from Yelp.More recent statistics from November 2018, depicted in the chart below, shows the monthly share of online food delivery sales. While Grubhub is still bringing in the majority of sales, DoorDash is quickly gaining ground.
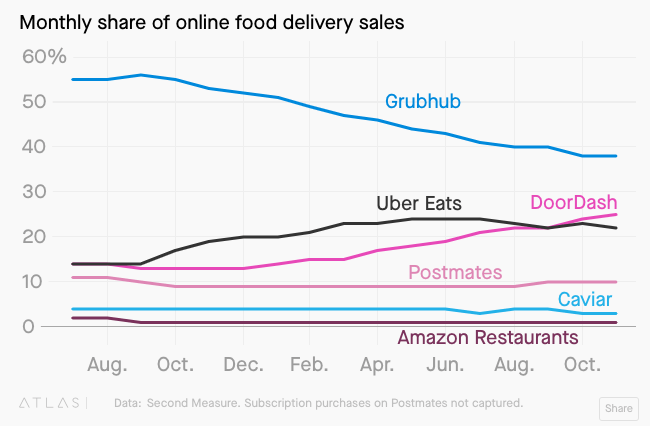
Chart: Quartz
What encourages customers to place larger orders and order more frequently?
Research suggests two things can boost order sizes and order frequency: loyalty programs and in-app suggestions. The statistics offer a further explanation:
- 45% of consumers say that offering mobile ordering and loyalty programs would encourage them to order more often, which generates higher revenues.
As more customers utilize online ordering, restaurants are linking their ordering platform to their customer loyalty program. When customers place an order, you can capture buying data and reward customers for their business whether the transaction happens online or in-store, all from the same app. Thanx can help you combine your food-delivery and loyalty platforms to increase incremental revenue.
- 1 in 4 consumers says they typically spend more via third-party apps, especially when prompted to add an item to the cart.
Online delivery apps that suggest additional menu items often result in larger, more profitable orders. A pop-up that asks a pizza lover if they’d like to add breadsticks to their order, for example, increases order size and profits.
What does revenue look like for online delivery?
Every owner has probably grappled with the idea of adding delivery. Many restaurants do turn a profit, but delivery isn’t for everyone. As the statistics below explain, delivery can drive revenue but it comes at a cost.
- Restaurants that outsource delivery generate $121.29 in revenue per customer.
How much are restaurants making in the online delivery game? It depends. Restaurants that outsource the delivery of the food generate $121.29 per customer due to hits to the margin. In the chart below, that number is represented by the blue line; revenue generated from platform-to-consumer. As you can see, the revenue continues to grow each year.
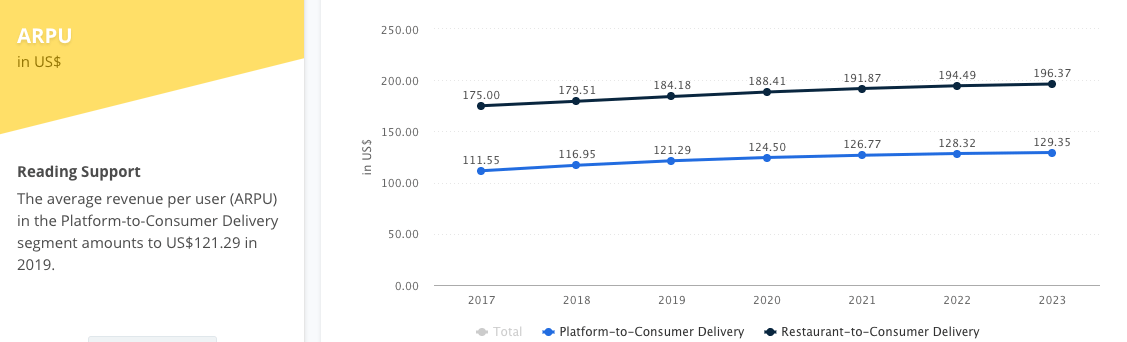
Chart: Statistia
- Restaurants that manage their own delivery generate $184.18 per customer.
When restaurants manage their own delivery, they make more because they aren’t taking the typical 10-30% hit to margins that outsourced delivery costs. This category, known as the restaurant-to-consumer category, sees a per customer revenue of $184.18. Revenue actually grows a bit faster for restaurants handling their own delivery as well. By 2023, revenue per customer will climb about $12, compared to an $8 per customer increase for those allowing third parties to deliver their meals.
- Delivery profits from one meal can be 30% less than dine-in profits.
Delivery has a dark side, and it comes in the form of weak profit margins and higher costs.Delivery profit margins aren’t as high as dine-in margins. The Wall Street Journal offered an example. When a customer comes into a restaurant and orders ribs, salad, and drink, he or she pays $30. When expenses are taken out, the restaurant profits $20.75, which is about 69% of the total check.When a customer orders delivery, the profits are often lower. Customers usually skip drinks when ordering in, which automatically cuts profits. Plus, labor, packaging, and delivery fees are all higher, which eats into the profits. The same meal ordered online for delivery only nets the restaurant $9.63, or 39% of the total check.
Chart: The Wall Street Journal
What kind of fees can restaurants expect with third-party delivery services?
Restaurants that elect a third-party ordering and delivery service will pay fees. Every platform is different, but both the restaurant owner and customer pay for the service. Restaurateurs will pay a commission of each sale and customers could pay “booking fees” and “busy fees.” Here’s what owners say about the fees:
- 68% of food and drink professionals pay a commission fee to their digital ordering technology supplier.
- 25% of restaurants say they pay more than 20% commission per order, 16% pay less than 10%.
- 82% of restaurant owners say the fees are too high and 33% say the fees aren’t worth offering delivery.
Wrap up
Delivery is probably the hottest restaurant trend happening right now, and it has owners buzzing. It’s a decision every restaurant owner should weigh. If you decide online ordering is right for you, reach out to Thanx to see how our online ordering integration works with a data-centered engagement platform. By marrying the two services, you can capture robust data, reward customers, and encourage your best guests to keep coming back.
.png)


.avif)
.avif)